Dahche Samir | IA|BE Actuary
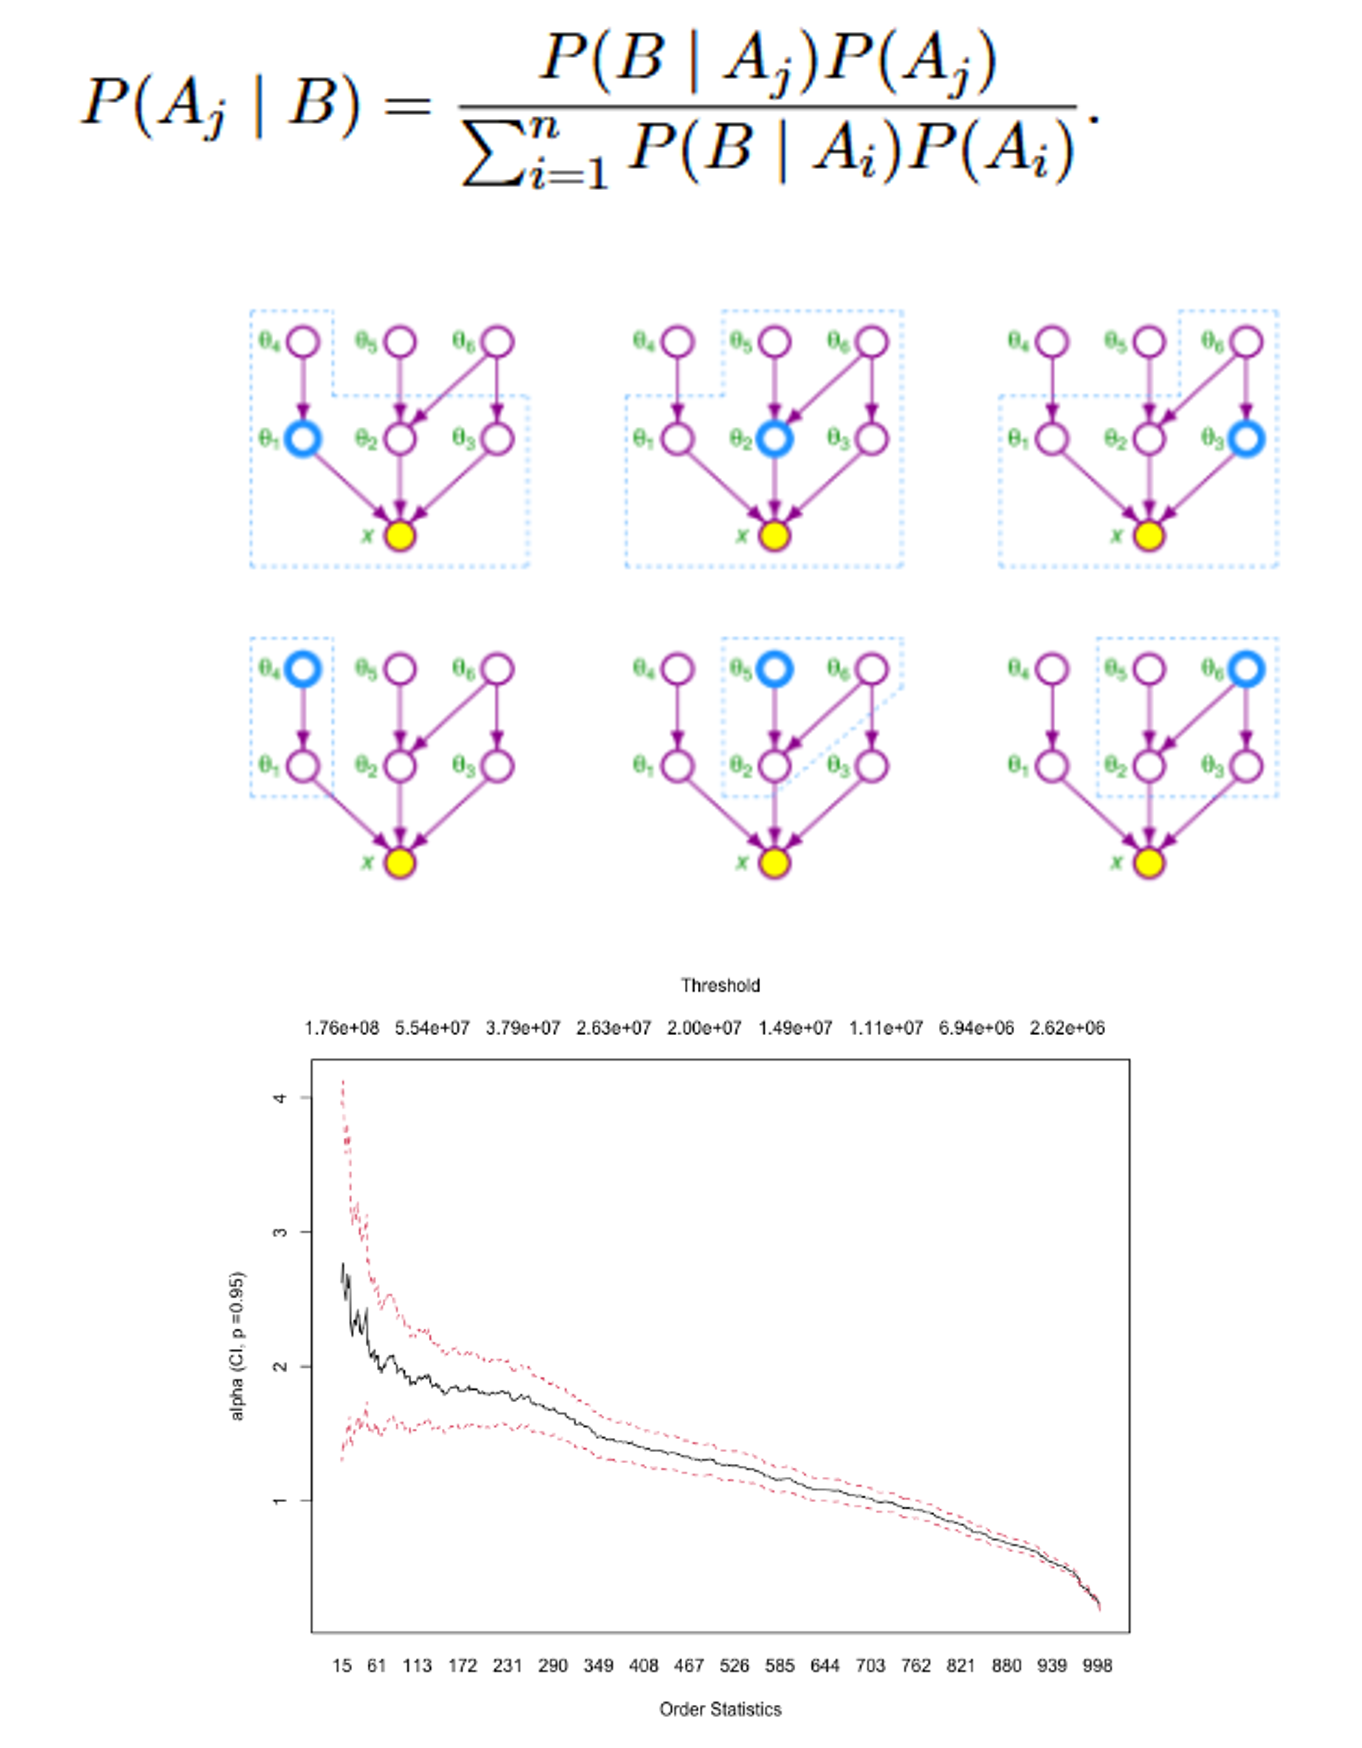
- Addressed the need for robust climate risk modeling in the insurance sector, where traditional models fail under rising frequency and severity of extreme events.
- Built a Bayesian Network (BN) framework to model causal relationships between climate drivers (e.g., CO₂, temperature) and disaster-induced damages.
- Integrated frequency modeling and Extreme Value Theory (EVT) for improved tail risk representation.
- Aimed to develop a flexible, data-driven approach to simulate and predict catastrophic financial losses under climate stress scenarios.
- Applications include capital requirement calculations under Solvency II and climate-informed risk evaluation.

- Constructed BN structure using expert input, literature-based models, and score/constraint-based algorithms (Hill-Climbing, ICA).
- Estimated conditional probability distributions via EM algorithm for handling missing data.
- Performed inference (CPQ, MAP) and belief updating to simulate climate scenarios.
- Integrated with a frequency/severity loss model and EVT (POT, GPD) to quantify VaR and Expected Shortfall at 99.5%.
- Validated model robustness through residual analysis and scenario stress testing.
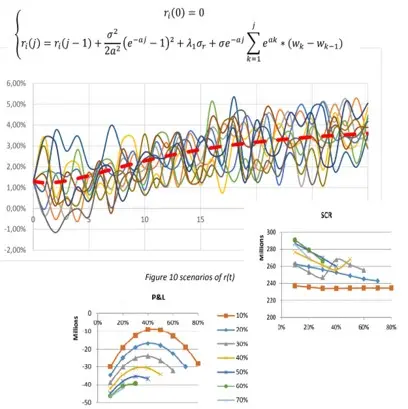
- Portfolio of temporary annuities.
- Assets invested in government bonds
- Analysis of statutory reserves, duration gap, interest rate and liquidity risks.
- Stochastic extension: dynamic asset allocation (deposits, mutual funds, zero-coupon bond), interest rates modeled via stochastic differential equations (Vasicek-like), market risk with profit-sharing and surrender behavior modeled endogenously.
- Deterministic model:
- Reserve and cash flow valuation
- Duration/convexity gap analysis
- Impact of parallel rate shocks (±0.5%)
- Hedging via interest rate swap
- Stochastic model:
- Monte Carlo simulations
- Surrender options & profit-sharing features
- Solvency Capital Requirement (SCR) at 99.5% confidence
- Sensitivity analysis: interest rate curve, bond maturity
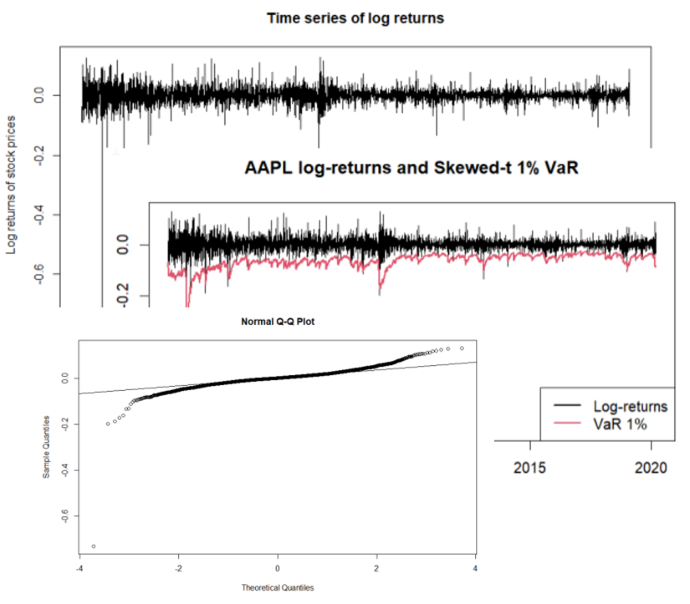
- Study of a publicly traded tech company’s stock, focusing on financial risk quantification.
- Analysis of log-returns behavior, distribution properties, and volatility dynamics.
- Objective: identify a reliable model to estimate Value-at-Risk (VaR) at 1% level.
- Exploratory analysis:
- Non-normal distribution (left skew, heavy tails)
- Autocorrelation analysis (returns & squared returns)
- Tests: Jarque-Bera, ACF, Ljung-Box
- RiskMetrics model (EWMA):
- 1-day 1% VaR estimation
- Model rejected through Dynamic Quantile backtesting
- GARCH(1,1) modeling:
- Gaussian: rejected (fails DQ test)
- Student-t, GED, Skewed-t: valid (passed diagnostics & backtest)
- Student-t GARCH chosen: best AIC/BIC, strong fit for heavy-tailed data
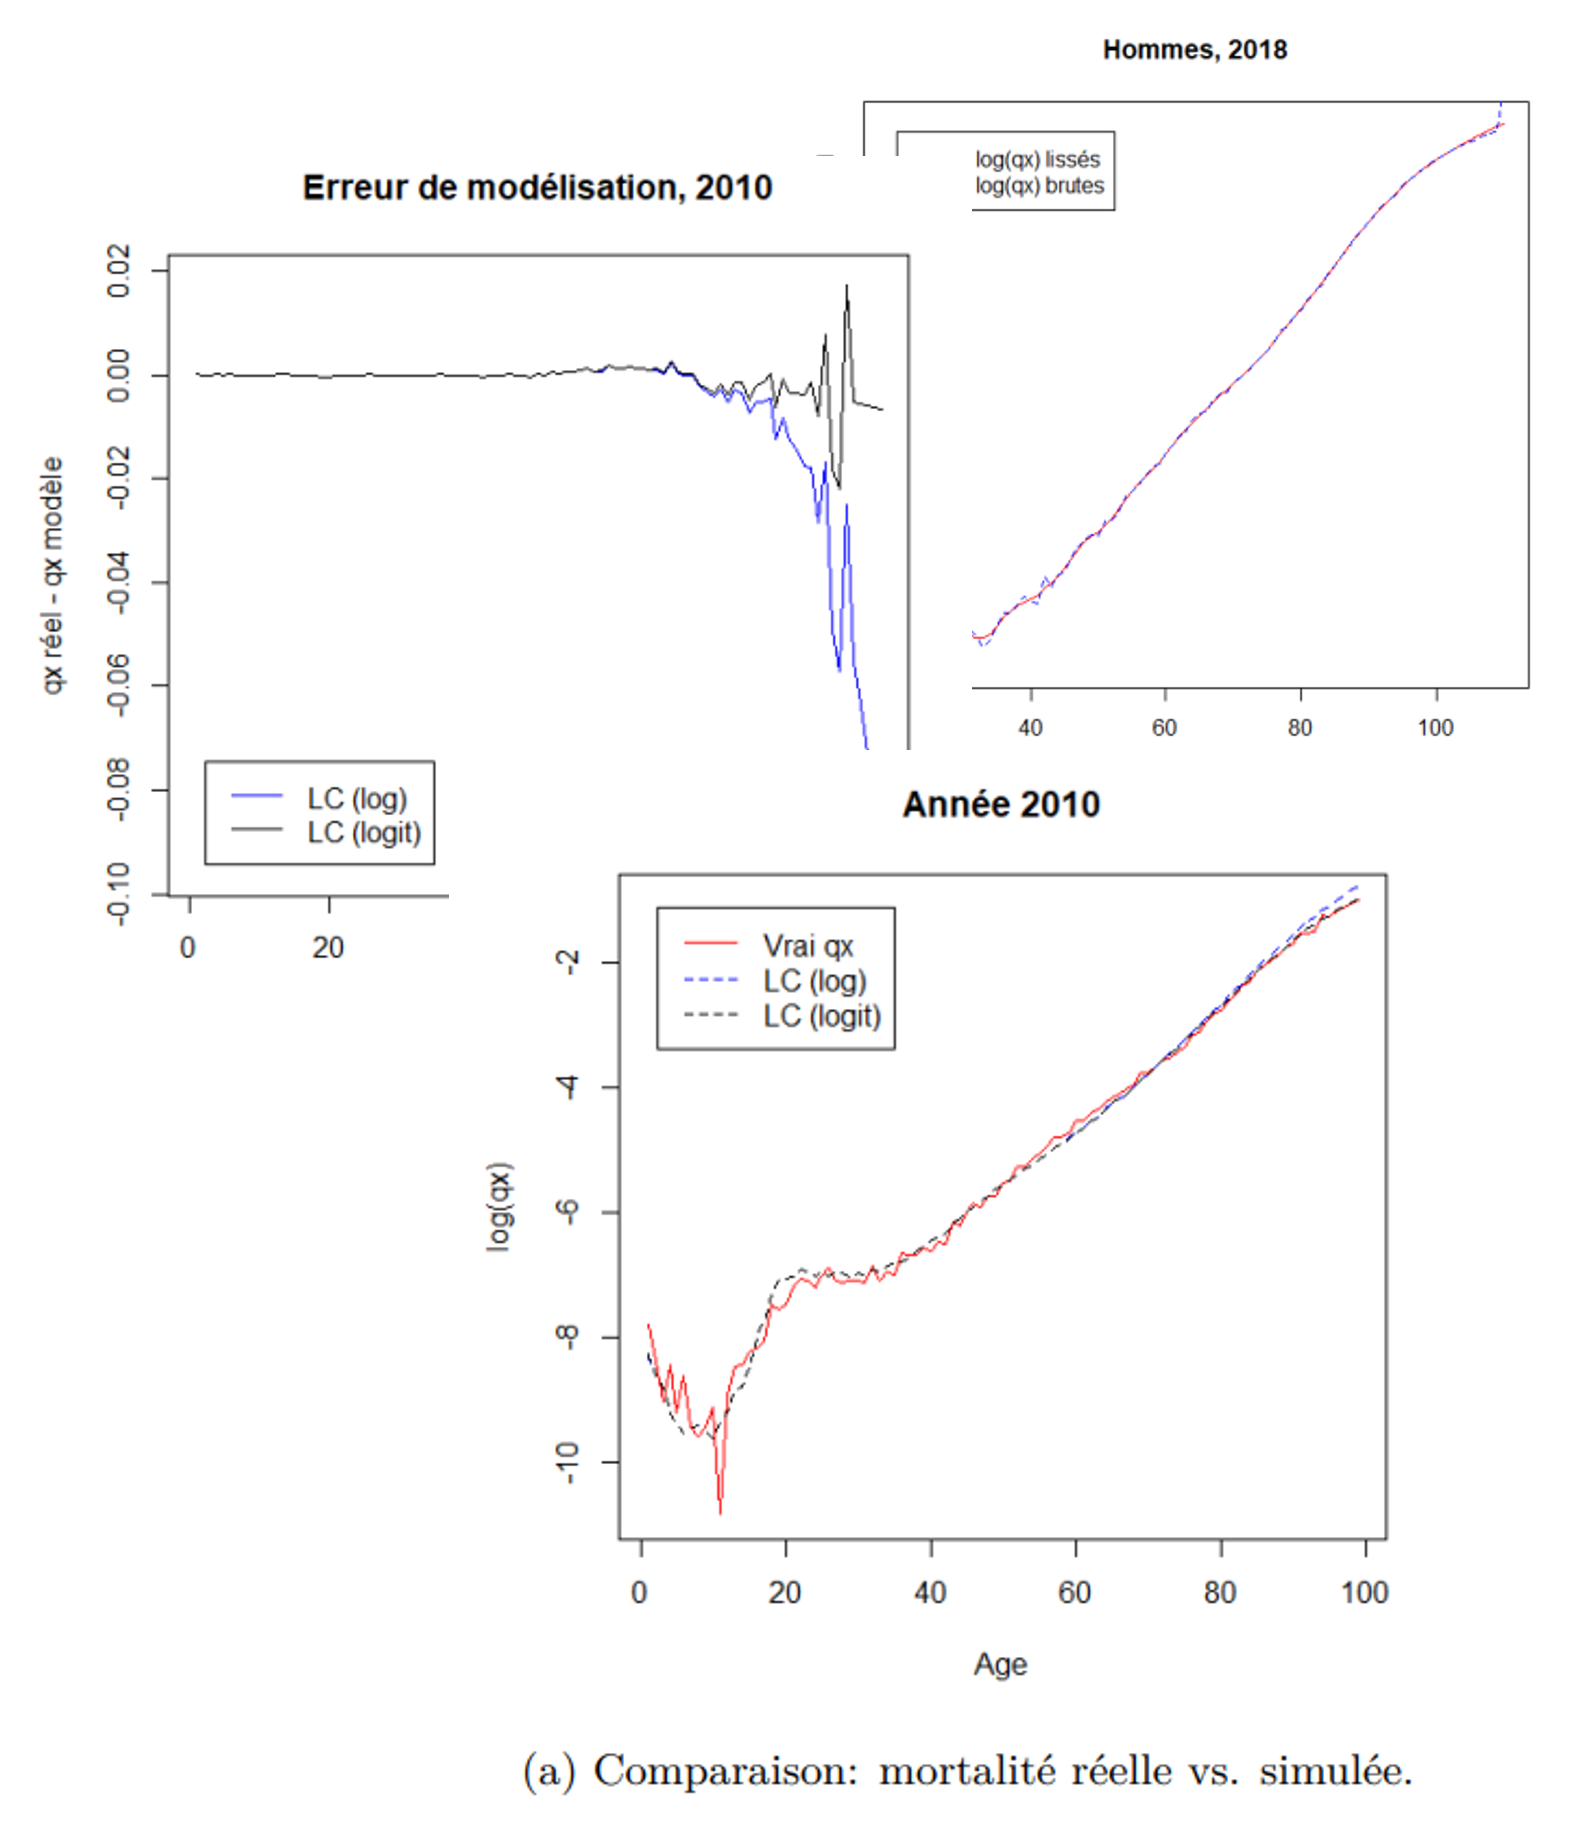
- Actuarial project focused on the Belgian life insurance market, using mortality data from 2008 and 2018 for males and females.
- Main objectives:
- Smooth and model mortality rates across age groups.
- Compute pure single premiums for term life insurance and life annuities.
- Explore and compare static vs dynamic mortality models for pricing.
- Data preprocessing & smoothing with Whittaker-Henderson.
- Pricing of term life insurance and life annuity based on smoothed mortality.
- Parametric model fitting: logit models via MSE & likelihood maximization.
- Dynamic mortality modeling with Lee-Carter and 1,000 simulations.
- Comparison of static vs dynamic pricing for annuities.
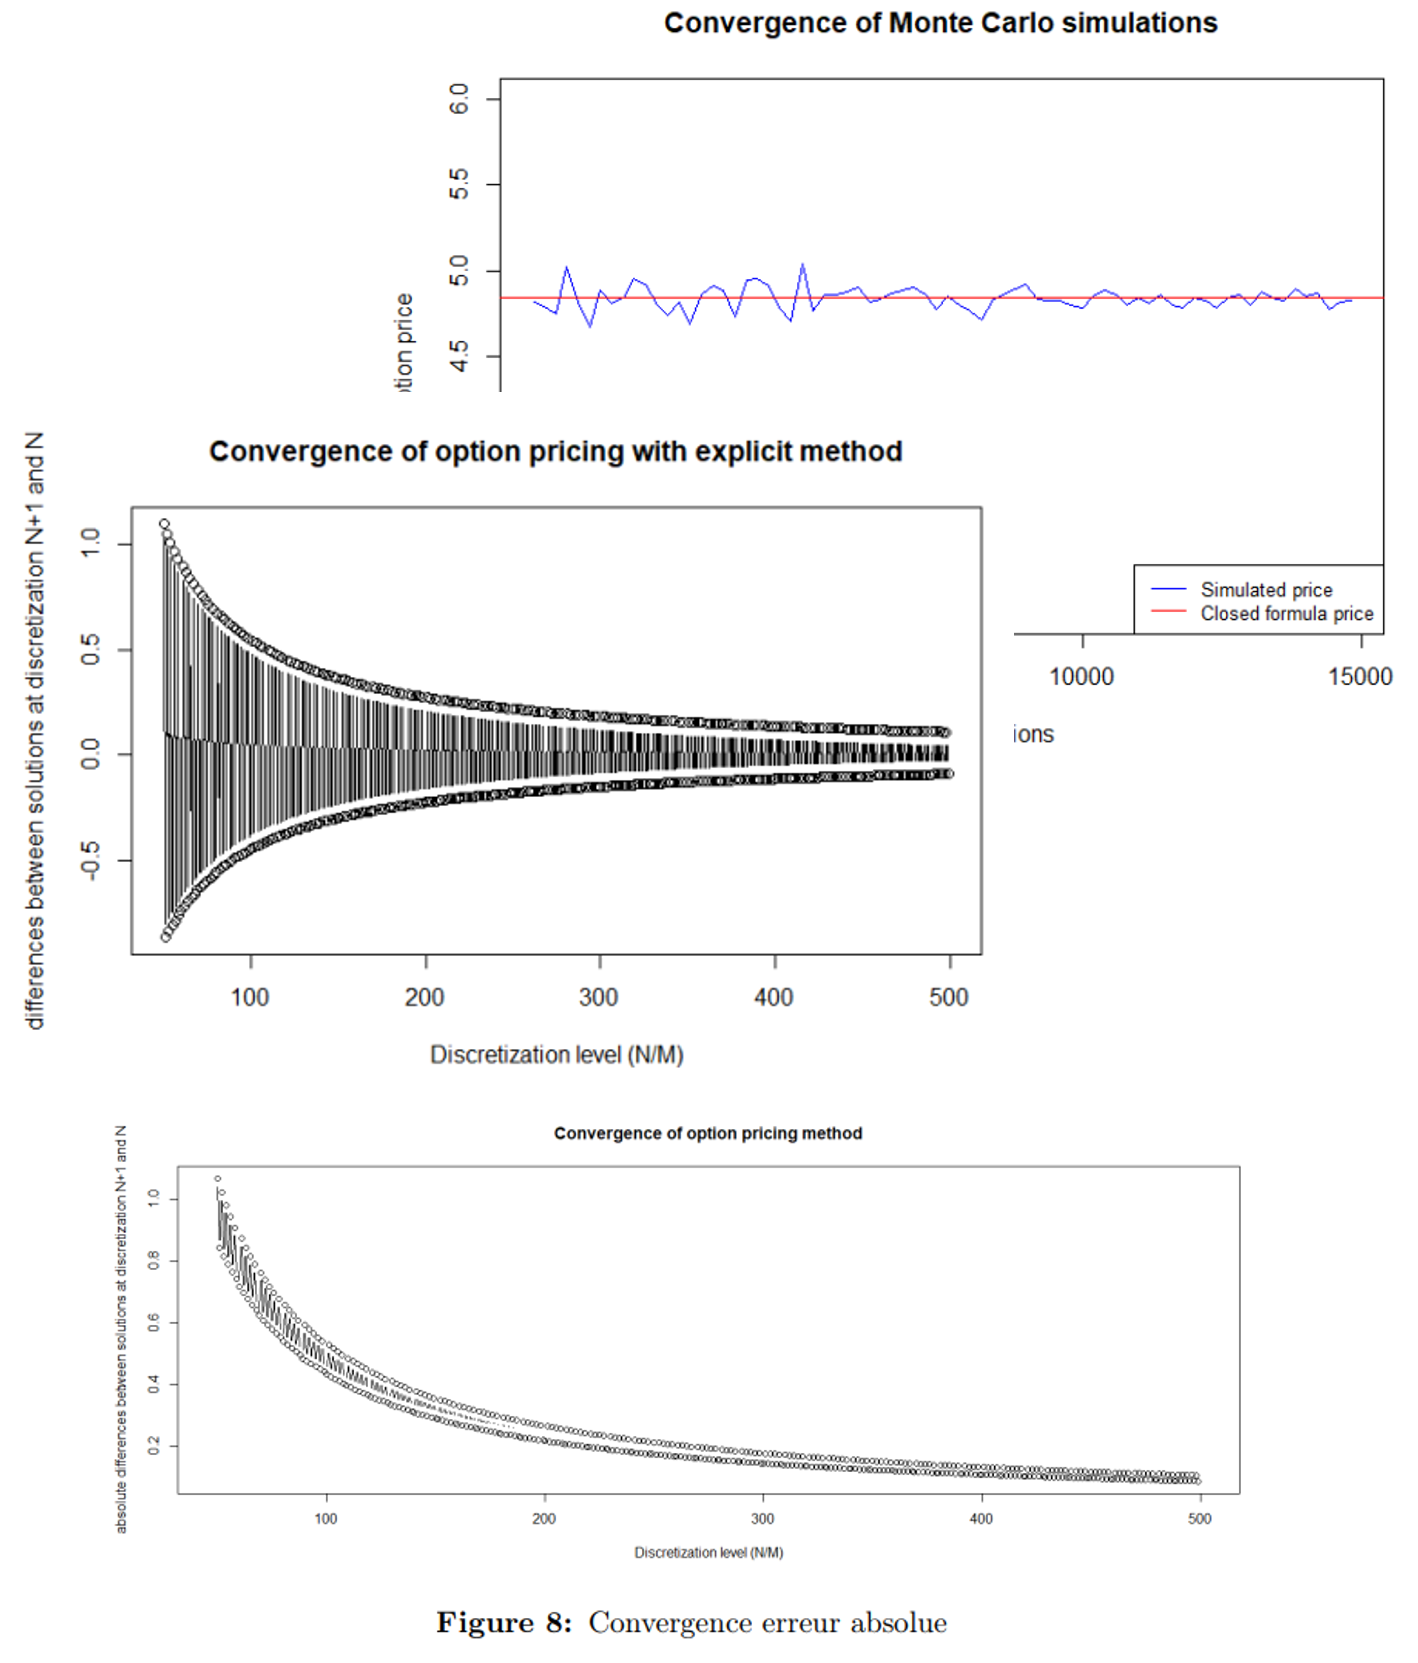
- Pricing of a nonlinear European spread option with a capped payoff structure, using various numerical techniques.
- Objective: evaluate and compare the precision, efficiency and convergence of multiple pricing models.
- Additional extension to a Bermudan version, allowing early exercise on discrete dates — introducing optionality and higher value.
- All methods operate under risk-neutral valuation with constant interest rate and volatility assumptions.
- Black-Scholes closed-form decomposition into two vanilla calls to obtain benchmark price.
- Monte Carlo simulations to approximate the expected discounted payoff; observed convergence with increasing paths.
- Finite Difference Methods:
- Solved PDE with explicit and implicit schemes.
- Studied stability and grid sensitivity via convergence plots.
- Binomial Trees:
- Stepwise pricing with backward induction.
- Adapted for Bermudan-style exercise by comparing early exercise value at each node.
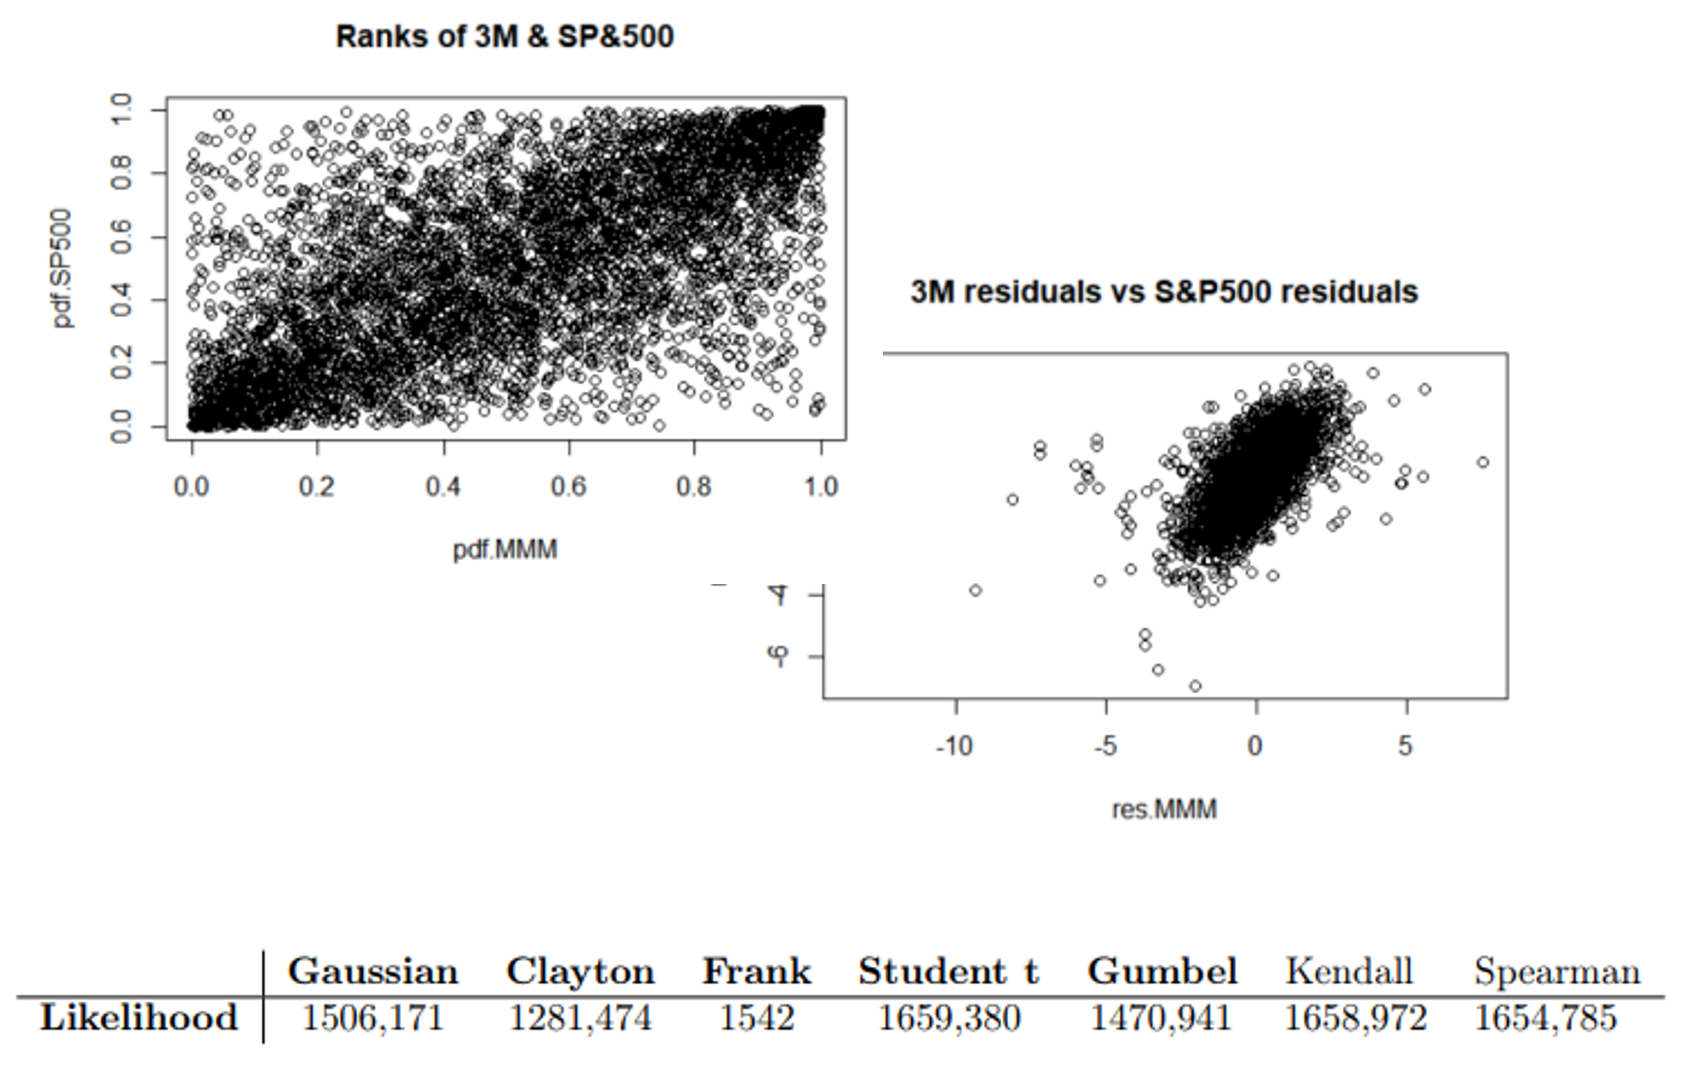
- Analysis of dependency and risk between 3M (MMM) stock and the S&P 500 index over 20 years (2000–2020).
- Objective: model correlated extreme losses using robust statistical tools beyond linear correlation.
- Standard time series models were extended to capture volatility clustering and tail dependence.
- Emphasis on copula-based modeling to accurately represent joint behavior, especially during stress periods (e.g., 2008 crisis).
- Final goal: evaluate portfolio risk (VaR & CVaR) and assess lower tail dependence.
- Computed log-returns for both assets and analyzed dependence through scatterplots and correlation metrics.
- Fitted GARCH(1,1) (3M) and GJR-GARCH(1,1) (S&P500) to extract standardized residuals.
- Estimated Dynamic Conditional Correlation (DCC) to observe time-varying relationships.
- Applied copula models (Gaussian, Clayton, Gumbel, Student-t) – selected Student-t via log-likelihood.
- Calculated 1% Value-at-Risk (VaR) and Conditional VaR for an equally weighted portfolio.
- Assessed tail dependence using conditional quantiles and theoretical tail indices.